Portfolio Analytics: Spot Actionable Trends In Your Bookings
What is Portfolio Analytics and how to use it?
One of the key features of PriceLabs is Portfolio Analytics, which provides you with valuable insights into the performance of your vacation rental portfolio.
Portfolio Analytics is a dashboard that allows you to see how your properties are performing in terms of occupancy rate, average daily rate (ADR), revenue per available room (RevPAR) and many more factors. This information is presented in easy-to-read charts and graphs, which allow you to quickly identify trends and make data-driven decisions about your pricing strategy. This is a very handy tool for a few different purposes and can be used regardless of whether you use PriceLabs Dynamic Pricing or not ( you still have to import the listings) :
- Reporting: get a high-level overview of how things are going. For example:
- This can be monthly revenue numbers,
- Listing level performance and more!
- Informing your revenue strategy: Provide detailed insights into trends in your reservations that can highlight changes you can make to your minimum stay and pricing strategy. For example:
- Length of Stay (LOS) trends
- Booking window trends
- Identifying underperforming listings: Let you easily find and review/adjust listings that are not performing well. For example:
- Scatter chart that allows you to select an area and make pricing changes to those properties
- Listing table with extensive information about each listing
- Market comps: Provide an easy way to compare your prices and occupancy trends against the market. For example:
- Choose a Market Dashboard in your account and compare your forward-looking prices and occupancy with the market data!
Important note about reservation data listed in charts by "stay date": Reservation data is prorated, and equal shares are attributed to each stay date. For example, if a 10-day-long reservation starts on April 30 and ends on May 10, then we distribute the revenue so that April gets 10% of it and May gets 90% of it. With that in mind, let's dive in!
Basics & Navigation
You'll find the Portfolio Analytics in the top menu bar, with 2 options: KPIs & Historic Reports and Pacing Reports.
Once you navigate to your preferred report page, you can apply filters allowing you only to view the data you need. You can view the metrics for your entire account, specific groups, specific listings, bedroom size, and even city. (For more details, check our guide here.) Make your selection and click "See Analytics". (You can also save your selected filters for easy access!) Please note that if you don't select anything, we will show data for all the listings in your account that aren't hidden.
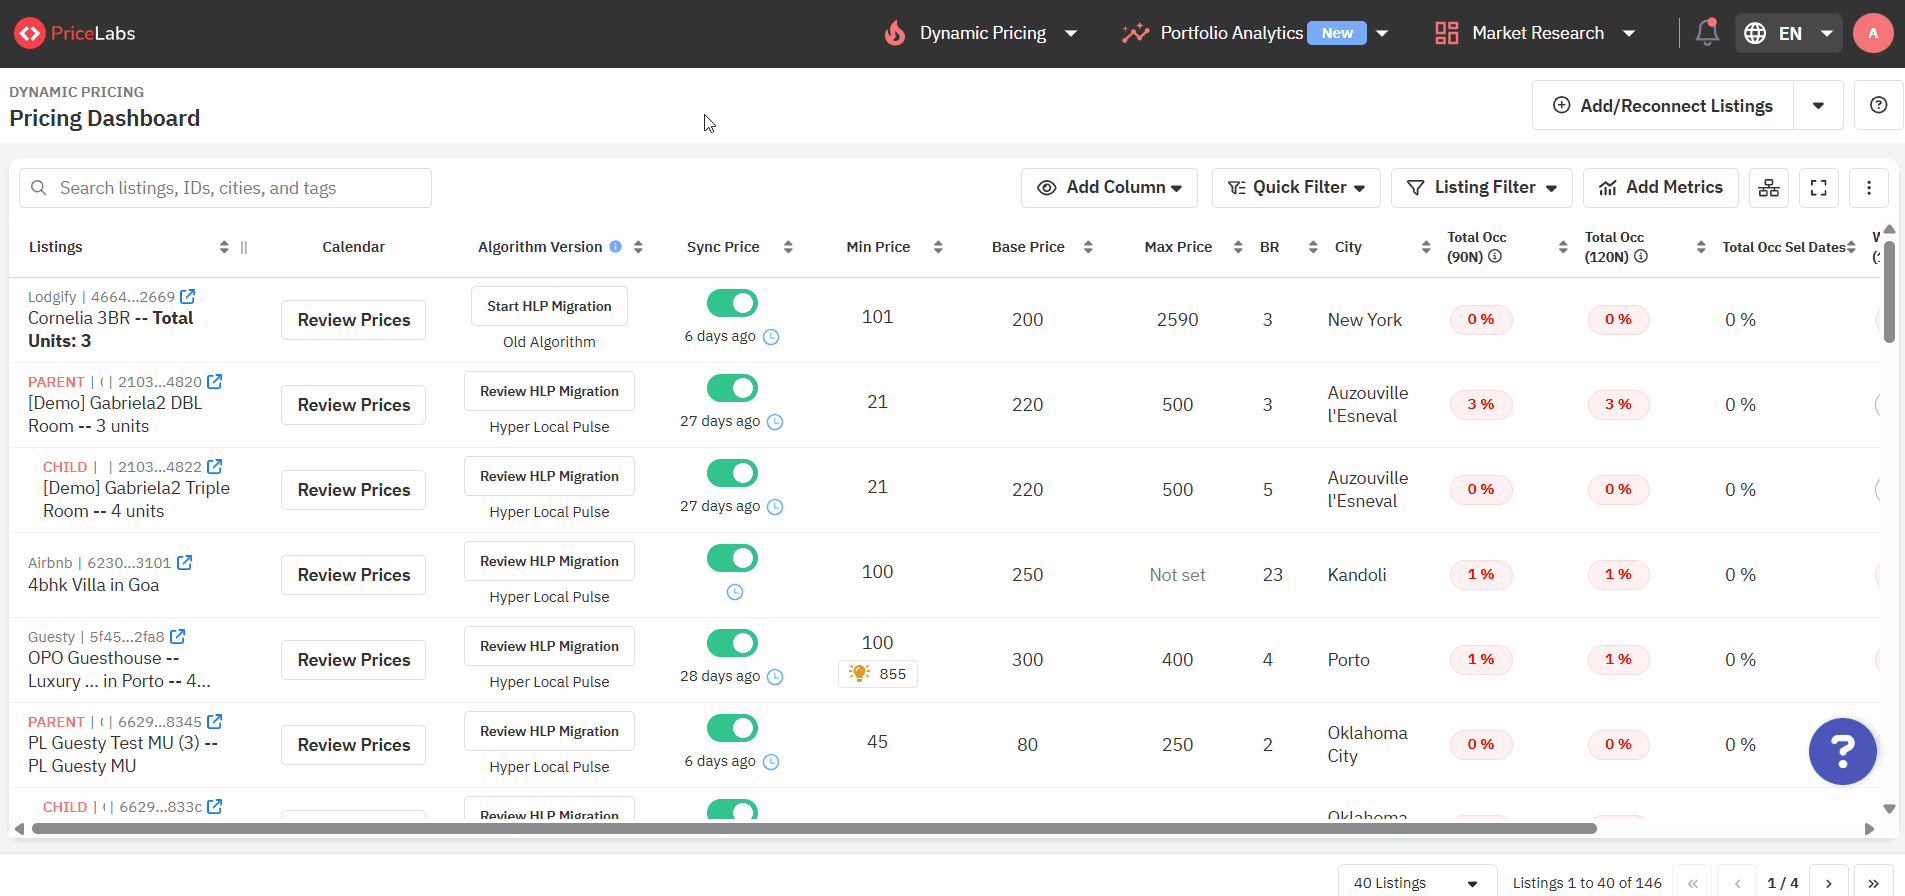
Once the report loads, you will find a handy navigation panel on the left that can take you to the various charts; otherwise, you can just scroll down.
How to learn more about Portfolio Analytics?
Once you have checked the above information, and have a brief idea about what Portfolio Analytics does, you can check the below topics to grow more with Portfolio Analytics.
KPIs & Historic Reports
This report is more backward-focused and not necessarily needed daily for decision-making. You can find the content under KPI and Historic reports below:
- KPIs
- Revenue/ADR Details
- Trends by Stay Date (Monthly, Weekly, Daily, or by Day of Week)
- Trends by Booking Creation Date (Monthly, Weekly, Daily, or by Day of Week)
- Length of Stay and Booking Window Trends
- Listing Level Metrics (Insights + Table)
Pacing Reports
- This report is more future-focused to bring out actionable information to drive changes in revenue management strategies and is good to be reviewed periodically.
- The Pacing chart in Portfolio Analytics gives insights into your booking rate against a benchmark, like last year or the market. You can gauge whether your portfolio is lagging or in line with previous trends. This tool also shows last year's final market occupancy rate, indicating the proportion of market inventory sold.
- Booking curves: This report shows the "evolution" of how your listings are performing in the current state.
Glossary of Terms
If you are new into Short Term/Mid Term Rentals, there are a few terms that can really come in handy while analyzing the data. We have combined all of the required terms together.
Trainings
Every day, we do PriceLabs trainings covering how to use PriceLabs and best practices! We run Portfolio Analytics training as well. During this session, we will discuss using PriceLabs Portfolio Analytics to build a profitable business.
Portfolio Analytics is a free real-time reporting system showing important KPIs and unit-level performance data.
You can use it to get a high-level overview of how things are going, build your revenue strategy, identify underperforming listings, and compare them against the market.
We will discuss the following:
- Various KPIs and what they mean
- Trends by stay date
- Comparing against the market
Please find the link to registration for our Portfolio Analytics training sessions here - Portfolio Analytics Training
Related Articles
Portfolio Analytics: Pacing Reports
This report is more future-focused to bring out actionable information to drive changes in revenue management strategies and is good to be reviewed periodically. The Pacing chart in Portfolio Analytics gives insights into your booking rate against a ...Portfolio Analytics: KPIs & Historic Reports
This report is more backward-focused and is not necessarily needed for daily decision-making. KPIs The first section of the report displays Key Performance Indicators (KPIs), allowing you to compare broad metrics across various dates to observe ...What is Portfolio Analytics and how to use it?
Portfolio Analytics is one of PriceLabs’ key features, providing insights into the performance of your vacation rental portfolio. It displays metrics like occupancy rate, average daily rate (ADR), and revenue per available room (RevPAR) through ...Market Dashboards - Booking Curves
The Market-Level Booking Curves section lets you visualize how Revenue, Occupancy, Average Daily Rate (ADR), and Revenue Per Available Room (RevPAR) are building up over time across the broader market. These charts use the familiar Days Until Stay ...Decoding Portfolio Analytics: How KPI & Historic Report Drive Smarter Decisions (A Compilation of Case Uses)
Understanding how to navigate and reach the graphs in Portfolio Analytics is important. However, knowing about how you can use this information to better set up your listings is equally important. So, let us go over some of the case uses for ...
Sign up for training
To help you get the most out of PriceLabs, we have training webinars in English, Spanish, Portuguese and French. Click here to Register.