Forecasting with Report Builder
You can now use Report Builder to forecast future rental revenue and occupancy for your listings. This helps you make smarter business decisions by giving you a better idea of what to expect in the months ahead.
Key Features
- New Forecasting Template: There’s a new “Forecasting” template available in Report Builder.
- Key Forecasts: You can now see predictions for:
- Rental Revenue
- Occupancy
- Which Listings Are Supported?
- All Single-Unit listings
- All Multi-Unit properties.
- Listings that are actively syncing
- Forecast Timeframe: Predictions cover future dates for which we generate prices (based on your PMS).
- Update Frequency: Forecasts are updated weekly, every Monday.
- View Levels: You can view the forecast for one or more listings
- By individual listing
- By group or sub-group
- At the full account level
How to Access Forecasting Functionality
- Head to Portfolio Analytics → Report Builder
- Under Report Templates, ensure that you are on All Templates or PriceLabs Templates
- Click Forecast Rental Revenue & Occupancy
Customizing Your Report
Selecting the Date Range
You can set the time frame or a specific date range for your report in the Stay Date Range section.
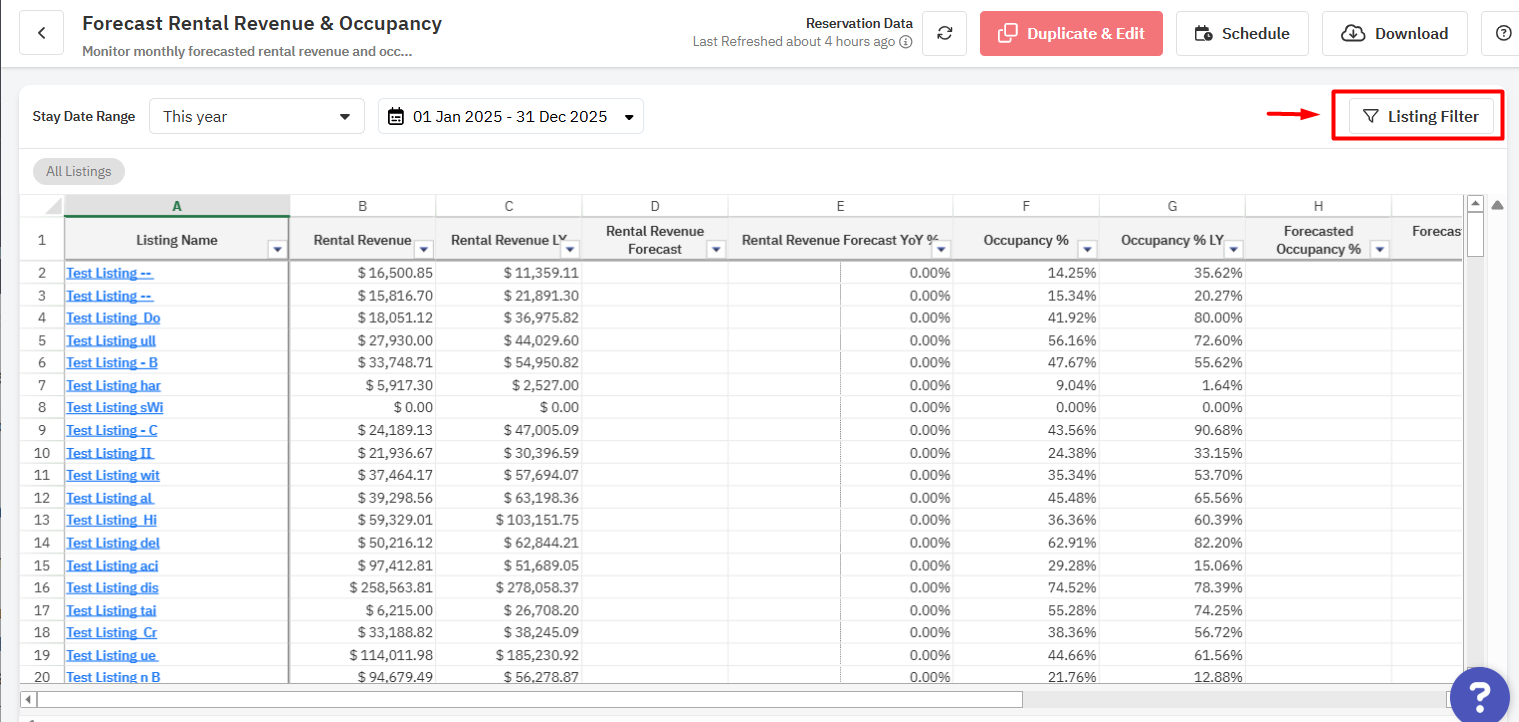
Filtering Listings to Add to the Forecast
To select which listings or set of listings to include in your report, you can apply listings filters like elsewhere in PriceLabs.
How the Forecast is Generated
The goal is to predict potential revenue by combining:
- Historical booking data
- Pricing logs
- Market demand and occupancy trends
A machine learning model is used to understand how different factors impact bookings, such as:
- Minimum stay rules
- Weekends vs weekdays
- Orphan gaps
- Holidays and seasonality
- Market demand
- Past booking patterns
For each future date, the model estimates the likelihood of a booking. These predictions are then adjusted using:
- Listing-level pacing (if available)
- Market-level pacing (if listing data is limited)
Revenue is calculated by combining:
- Predicted demand
- Adjusted pricing signals using current and past ADRs
Why we use uncustomized price instead of recommended price:
- For far-out dates, recommended prices may include higher premiums. In reality, bookings often happen later when prices adjust downward
- Using recommended prices directly can overestimate revenue
- That’s why we use uncustomized prices (market-driven baseline) and further adjust them using past and current ADR trends for better accuracy.
The forecast can be generated live in Report Builder for syncing listings. After that, it automatically gets refreshed every week.
Accuracy of the Forecast
- Timeframe: The forecast is more accurate for the next few months than for those further out.
- Historical Data: While not required, having last year's reservation data available makes the forecast more accurate, as it provides the model with a more robust baseline for its predictions. If your last year's bookings are not showing in PriceLabs, you can upload them by following Upload Reservations Using CSV in Portfolio Analytics.