Creating Reports Tailored to Your Hotel (Report Builder)
The PriceLabs Report Builder is a powerful and free tool designed specifically to support hosts and hotel operators in streamlining reporting and boosting performance analytics. With this tool, you can design, customize, and save reports that align with your hotel’s business needs and regular performance reviews. All reports can be downloaded in Excel (.xlsx) format, giving you full flexibility to make additional edits and analysis in Excel.
Accessing the Report Builder
Follow these steps to access and start using Report Builder in your PriceLabs account:
- Log in to your PriceLabs account.
- Navigate to the top menu and click on “Portfolio Analytics.”
- From the dropdown, select Report Builder.
- This will take you to the main Report Builder dashboard.
- Explore the available templates:
- PriceLabs Templates: Pre-built reports tailored for hotel performance analysis.
- My Templates: Any custom reports you’ve created and saved.
- Pinned Templates: Key templates may also appear pinned to the header menu for easy access.
Home Screen
When you enter the Report Builder section, you see certain report templates that are added by default to your account (PriceLabs Templates), you will see PriceLabs as the creator for these reports. You will also see all reports that you have Saved as a Template. Following are the actions you can perform on these reports-
- Delete Template - Delete an existing report template. Not applicable for PriceLabs Templates.
- Edit Template- Edit characteristics of an existing report template. Not applicable for PriceLabs Templates.
- Copy Template - Copy an existing report template
- Download Report - Download the report with fresh data
PriceLabs Templates for Hotels
While there are templates for both Short Term Rentals and Hotels, below are the report templates curated specifically for hotel operators. These are found under the “PriceLabs Templates” folder.
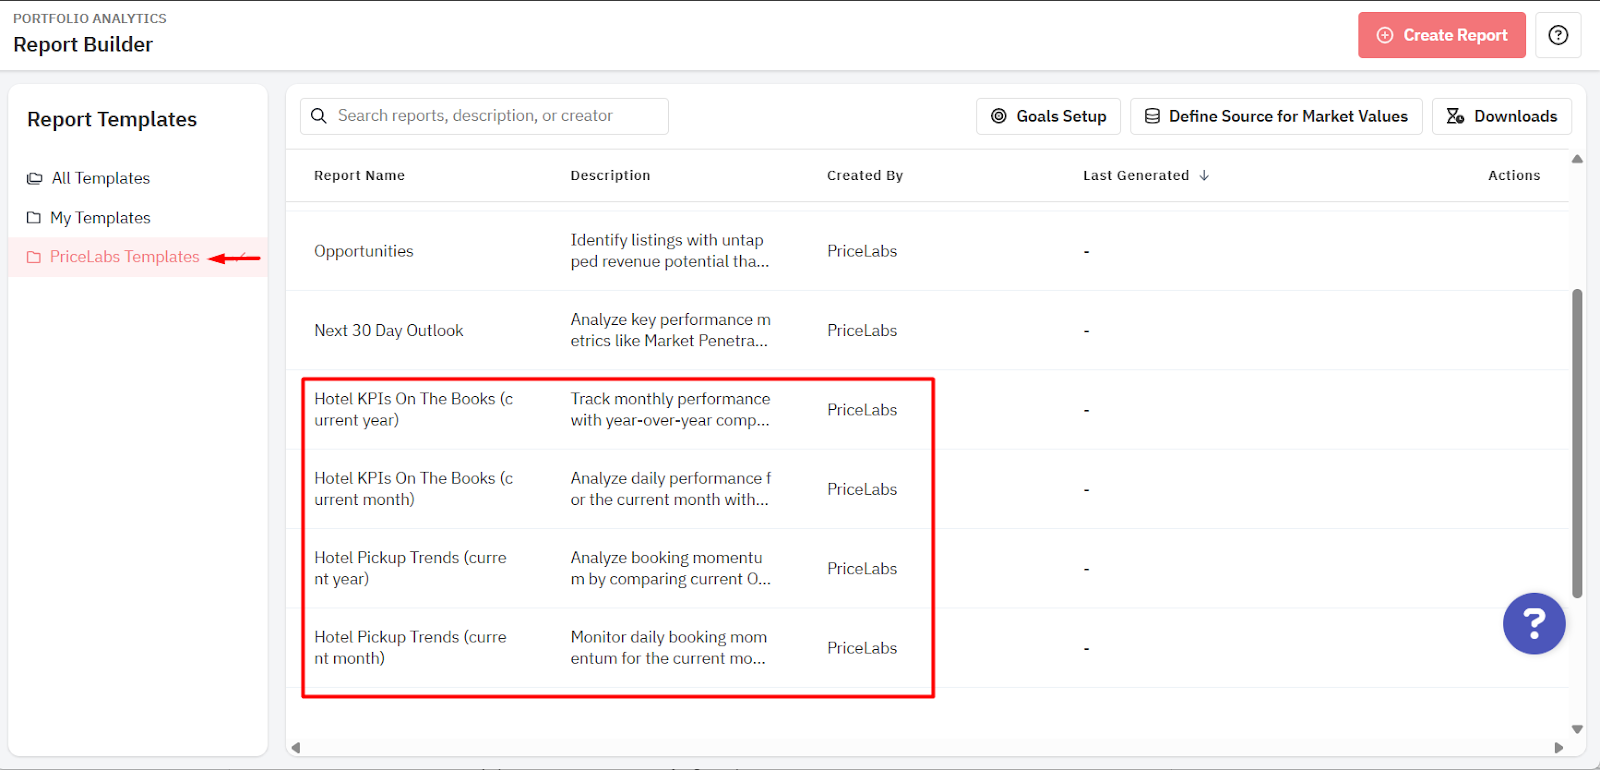
- Hotel KPIs On The Books (current year)
- Track monthly performance with year-over-year comparisons. Monitor key KPIs against both last year's actuals and final figures, helping identify trends and make data-driven revenue decisions.
- Stay Date Range: current year
- Hotel KPIs On The Books (current month)
- Analyze daily performance for the current month with year-over-year comparisons. Track KPIs against last year's actuals and final figures to spot day-level patterns and opportunities.
- Stay Date Range: current month
- Hotel Pickup Trends (current year)
- Analyze booking momentum by comparing current OTB metrics with recent pickup patterns across 3-day, 7-day, and 30-day windows. Identify booking pace changes to adjust revenue strategies.
- Stay Date Range: current year
- Hotel Pickup Trends (current month)
- Monitor daily booking momentum for the current month, comparing OTB metrics with recent pickup patterns across multiple windows. Spot short-term trends and react quickly to booking pace changes.
- Stay Date Range: current month
For a detailed guide on how to create reports, please see: Getting Started with Report Builder.
Related Articles
Getting Started with Report Builder
PriceLabs Report Builder is a free tool designed to enhance your reporting and data analysis capabilities within PriceLabs. With report builder, you can create, customize, and save reports that are tailored to your business and your regular ...Setting Goals for Report Builder Reports
The Goals Setup feature in Report Builder enables users to set monthly goals (or targets) for key metrics like Total Revenue, Rental Revenue, ADR, RevPAR, and Occupancy. This functionality allows users to track progress towards their goals with ...How to Use Comp Sets for Benchmarking
Use a Comp Set to measure how your listings perform against a tailored market. Below are three PriceLabs tools that let you apply Comp Sets in different, complementary ways — each section focuses on what matters and how it helps. Dynamic Pricing: ...Bookings Report in Portfolio Analytics
The Bookings Report is a newly added page within Portfolio Analytics that provides a consolidated view of all booked and blocked reservations across all listings in your account. It surfaces essential details like reservation dates, booking status ...Portfolio Analytics: Pacing Reports
This report is more future-focused to bring out actionable information to drive changes in revenue management strategies and is good to be reviewed periodically. The Pacing chart in Portfolio Analytics gives insights into your booking rate against a ...
Sign up for training
To help you get the most out of PriceLabs, we have training webinars in English, Spanish, Portuguese and French. Click here to Register.