Understanding Owner Analytics Dashboard
This is still in beta and not available to all users. To join the beta testing group, please reach out to support@pricelabs.co.
Revenue Recognition
Before viewing your dashboard, you can now choose how revenue is attributed to match your specific financial and operational workflows.
Three Accounting Models: Choose exactly how your revenue is recognized across the platform:
- Pro-Rated on Stay Dates (Default): Smooths revenue across the actual nights of a stay (ideal for trend analysis).
- Check-In Date: Attributes 100% of the reservation revenue to the arrival day.
- Check-Out Date: Attributes 100% of the reservation revenue to the departure day (ideal for financial reconciliation).
Owner Analytics Dashboard Sections
The Owner Dashboard is built from customizable sections. The data is calculated based on the Stay Dates selected on the dashboard. By default, the stay date is always set to “This Year”
1. AI-generated Overview Notes
An AI assistant within the Owner Analytics tool that transforms raw data into professional, client-ready narratives instantly.
- Contextual Note Generation: With one click, generate specific insights from all sections, like Listing Performance and Benchmarking.
- Comprehensive Summaries: The AI synthesizes your entire report into a high-level executive summary, identifying the "core narrative" of the period.
- Data-Driven Accuracy: The AI agent is strictly tied to your active filters and metrics—it identifies trends, spots outliers, and translates YoY changes into clear language.
- Full Editorial Control: Every AI-generated note populates in an editable text box, allowing you to refine the tone or add a personal touch before sending it to owners.
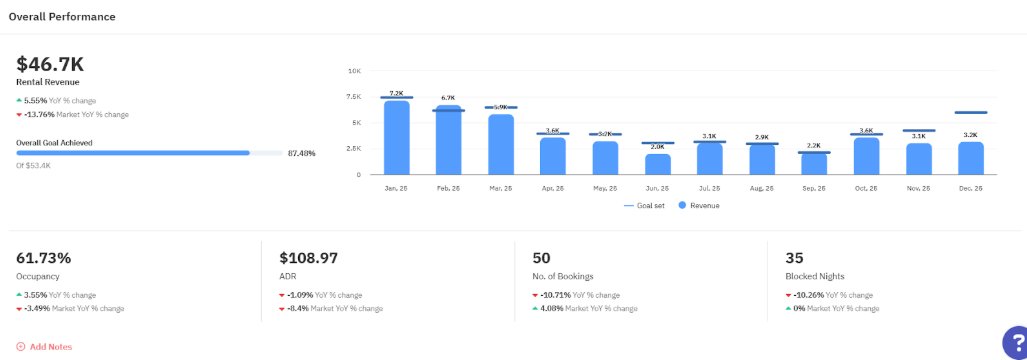
2. Overall Performance
This section provides a high-level summary of aggregated performance. Each KPI can show the Current Value, YoY % Change, and Market YoY % Change. The Revenue KPI also shows goal completion (if set up) and a Month-over-Month chart of revenue generated, along with revenue goals.
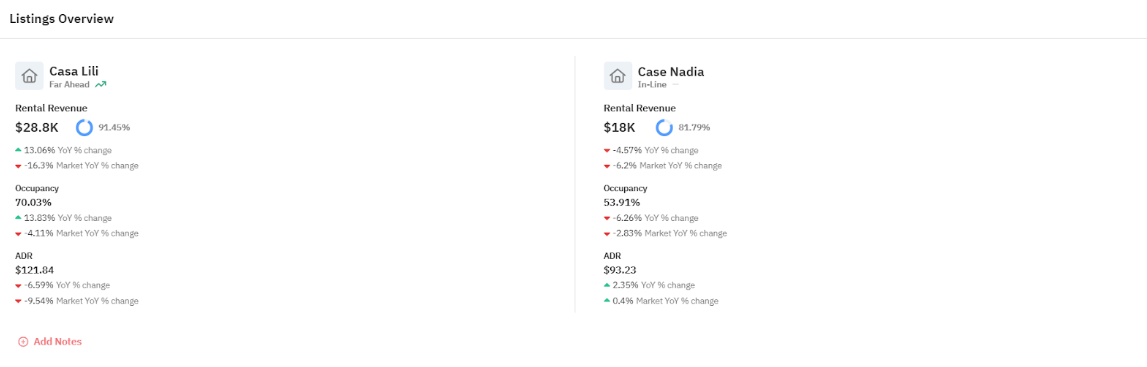
3. Listing Overview
This section provides a card view breakdown for each property’s KPIs. The available metrics and comparisons are the same as in the “Overall Performance” section.
The Performance Icon on the “Revenue” metric shows the overall performance grade by comparing your revenue change from the same time last year to the “Average Market Revenue” change in the same period.
Note that the section is not available if your dashboard contains only one listing.
4. Performance Benchmarks
This is a detailed monthly or weekly performance on the key metrics—Revenue and Occupancy. You can also compare against the same time last year and the market in the same period.
If your dashboard contains multiple listings, you can view data for “All Listings” (aggregated) or for each individually.
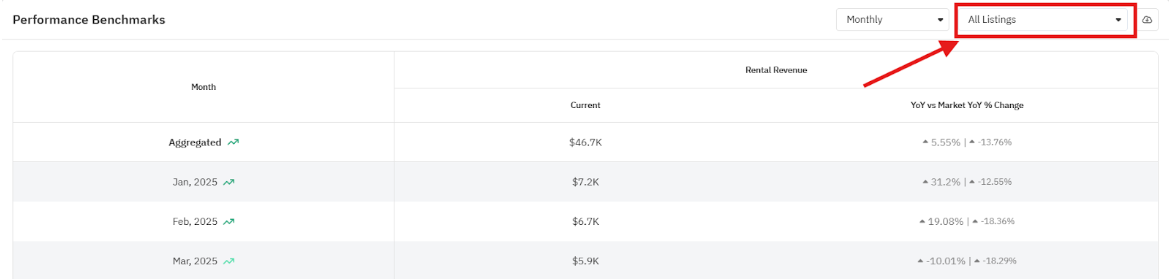
The Performance Icon on the “Revenue” metric shows the overall performance grade by comparing your revenue change from the same time last year to the “Average Market Revenue” change in the same period.
The status is determined as follows:
- Far Ahead: If the delta is 10% or greater
- Ahead: If the delta is between 3% and <10%
- In-Line: If the delta is between >−3% and <3%. (i.e., performance is closely tracking the market trend)
- Behind: If the delta is between −10% and ≤−3%
- Far Behind: If the delta is −10% or less
5. Future Performance Forecast
This section visualizes how your current dynamic pricing setup is projected to perform against financial goals over upcoming months. The chart displays Rental Revenue Forecasts (Bars) alongside Rental Revenue Goals (Markers) on the left axis, overlaid with your Occupancy Forecast (Line) on the right axis.
This section can be toggled on or off via your Configuration Panel (Default state: Not Active).
6. Future Price Setup
This shows advanced daily timeline mapping Your Final Price (Line) relative to local Market Prices, with discontinuous line segments displaying Booked Prices for secured dates and clear contextual shading for local high-demand Events.
To maintain data integrity, both sections automatically compute forward-looking dates only. If a report's selected date range sits entirely in the past, or if selected properties are non-syncing, these sections automatically suppress themselves to avoid displaying empty or misleading data cells.
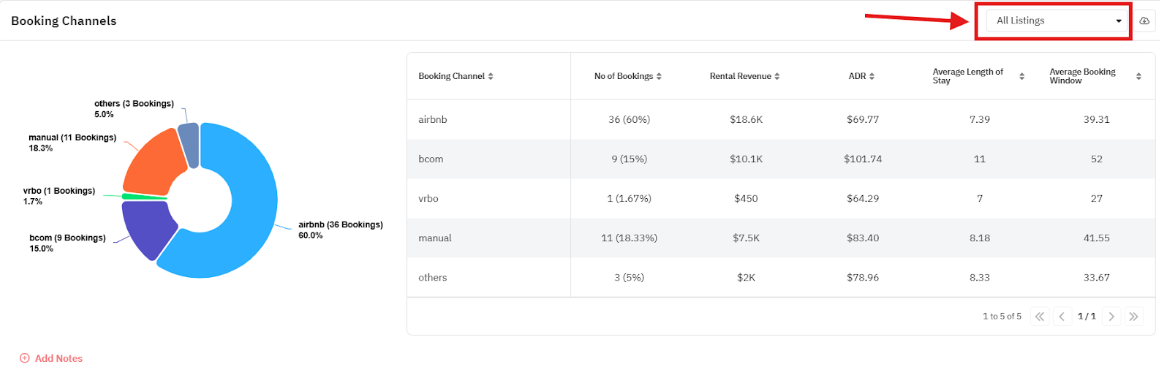
7. Booking Channel
The table shows the distribution of bookings by source, along with Revenue, ADR, Average Length of Stay, and Average Booking Window for each source.
If your dashboard contains multiple listings, you can view data for “All Listings” (aggregated) or for each individually.
Note that the section is only available if at least one of your PMSs sends us the booking source details.
Note that the section is only available if at least one of your PMSs sends us the booking source details.
8. Bookings between stay dates
This section lists recent bookings over the specified stay date period. Available booking details include Check-in Date, Check-out Date, Booked Date, Revenue, Booking Channel, and Status.
9. Additional Notes
This section allows you to include critical qualitative context alongside your performance metrics. Here, you can document non-financial updates such as maintenance repairs, housekeeping notes, or upcoming property improvements. Your custom notes appear in the downloaded PDF, ensuring they are the last thing the owner reads.
Customizing the Owner Analytics Dashboard
Configure Layout Panel
Once created, you can customize the sections, metrics, and data shown to the owner using the Configuration panel. You have full control over the sections and KPIs displayed.
- Revenue Metric Selection
This choice affects all monetary metrics within the dashboard. Select whether the dashboard should use Total Revenue or Rental Revenue for all the corresponding metrics (Revenue, RevPAR & ADR). The dashboard defaults to Rental Revenue
Note that Market YoY% Change is not available for Revenue, ADR, and RevPAR if Total Revenue is selected. - Comparison Metric Selection
This choice affects all metrics within the dashboard. Select whether the YoY % Change, Market YoY % Change, and Revenue Goals should be shown in the dashboard. - Add/Remove Sections
Use the panel to enable or disable entire sections of the dashboard.
Note: The Overall Performance section is required and cannot be removed. - Configure Metrics
For the Overall Performance, Listing Overview, and Performance Benchmarks sections, you can add or remove metrics to display on the dashboard. Note that the primary Revenue Metric is locked in all the sections.
Metrics available for “Overall Performance” and “Listings Overview” sections: - Revenue (Locked)
- Occupancy %
- ADR
- RevPAR
- Total Bookings
- Average Length of Stay
- Average Booking Window
- Blocked Nights
- Last Booked Date (Only available for Listings Overview section)
Metrics Available for Performance Benchmarks section:
- Revenue (Locked)
- Revenue YoY % Change
- Market Revenue YoY % Change
- Revenue Goal Completion %
- Occupancy %
- Occupancy YoY % Difference
- Market Occupancy YoY % Difference
- Booked Nights
- Blocked Nights
Adding Notes
- Overview Note: Add an overview note at the top of the dashboard to summarize the entire period.
- Section Notes: Add any specific note to any active section (e.g., Performance Benchmarking) to explain trends or your strategy.
Downloading PDF
This feature allows you to generate a shareable, branded version of your Owner Analytics Dashboard. The exported PDF mirrors the dashboard configuration exactly, including selected sections, metrics, and revenue goals.
You can customize the exported PDF to align with your company’s branding:
- Add an optional name card at the top of the report
- Upload your company logo
- Apply your brand colors throughout the PDF design
These settings ensure the exported document is fully white-labeled for professional distribution to owners.
Important Limitations
- For multi-listing dashboards, the Performance Benchmark and Booking Channels sections are locked to the "All Listings" view.
- The Bookings list is capped at 500 records to ensure optimal PDF generation performance.
Related Articles
Performance Metrics on PriceLabs Dashboard and Multi Calendar
Why Performance Metrics & How to Use them for Revenue Management? Metrics are the backbone of measuring success and finding areas of improvement. With the new performance metrics, you can easily sort, filter, and view listings across 7+ useful ...Creating Owner Analytics Dashboards
This is still in beta and not available to all users. To join the beta testing group, please reach out to support@pricelabs.co. Owner Analytics allows you to efficiently generate, customize, and manage professional performance dashboards for your ...Market Dashboard Use Cases
Estimated revenue The Market Dashboard allows you to evaluate your listing's performance by comparing its revenue with market averages for the selected period. If your earnings are below the market average, you can adjust your pricing strategy to ...What is Portfolio Analytics and how to use it?
Portfolio Analytics is one of PriceLabs’ key features, providing insights into the performance of your vacation rental portfolio. It displays metrics like occupancy rate, average daily rate (ADR), and revenue per available room (RevPAR) through ...Portfolio Analytics : Terminology
Glossary of Terms Length of Stay (LOS): The number of nights a booking is for. For a booking where guests check in on Friday and check out on Sunday, the Length of Stay would be 2 (Friday night and Saturday night). RevPar: RevPAR can effectively ...
Sign up for training
To help you get the most out of PriceLabs, we have training webinars in English, Spanish, Portuguese and French. Click here to Register.