Market Dashboards - Length of Stay versus Booking Window
The Future Length of Stay chart shows the most common length of stay (LOS) for recent bookings, based on the selected period (e.g., last X days). It helps you understand how long guests are typically booking for different upcoming stay dates, making it easier to spot patterns such as shorter or longer stays during specific periods.
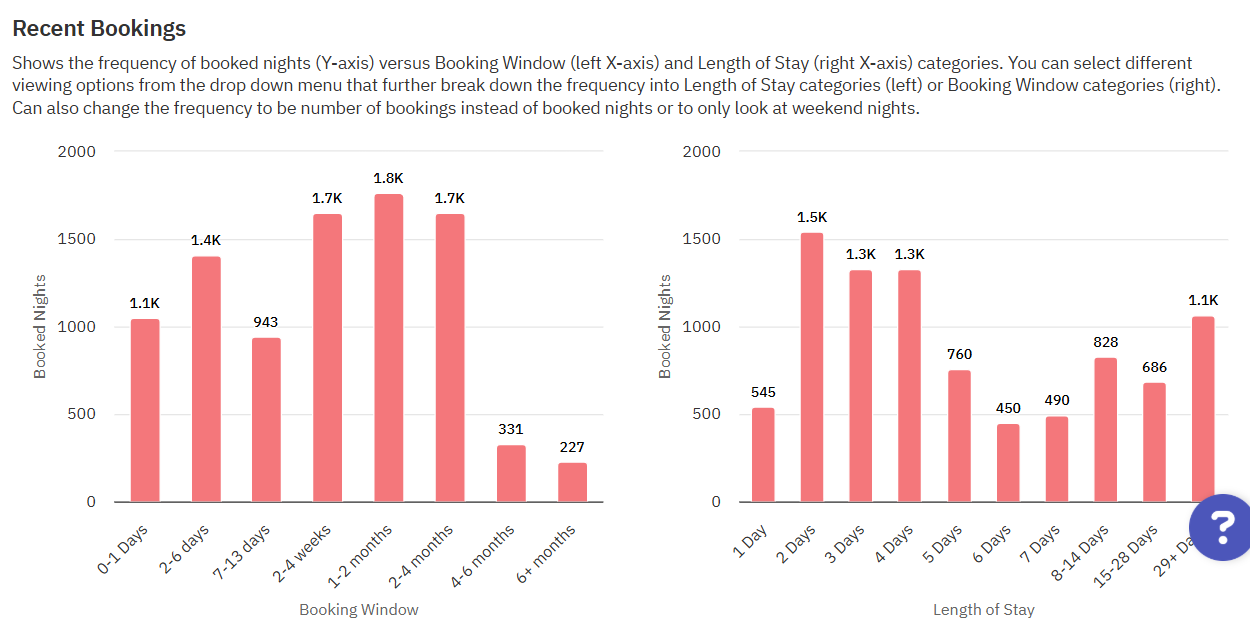
The Recent Bookings chart shows how often nights are booked based on booking window and length of stay. You can adjust the view to focus on either category, switch between booked nights or number of bookings, and filter for weekends only.
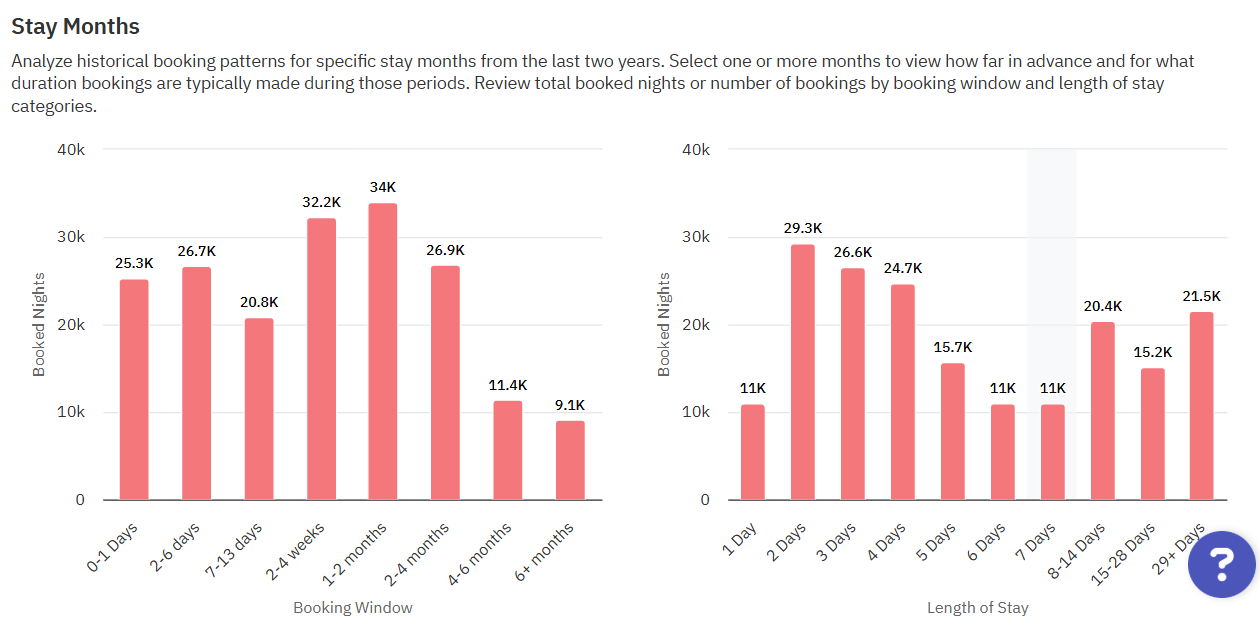
The Stay Months chart shows historical booking patterns for selected months from the past two years. You can see how far in advance and for how long stays are booked, and switch between viewing booked nights or number of bookings.
You can see different options to view data on booked nights and bookings if you click the option icon on the upper right of the section. The options there are:
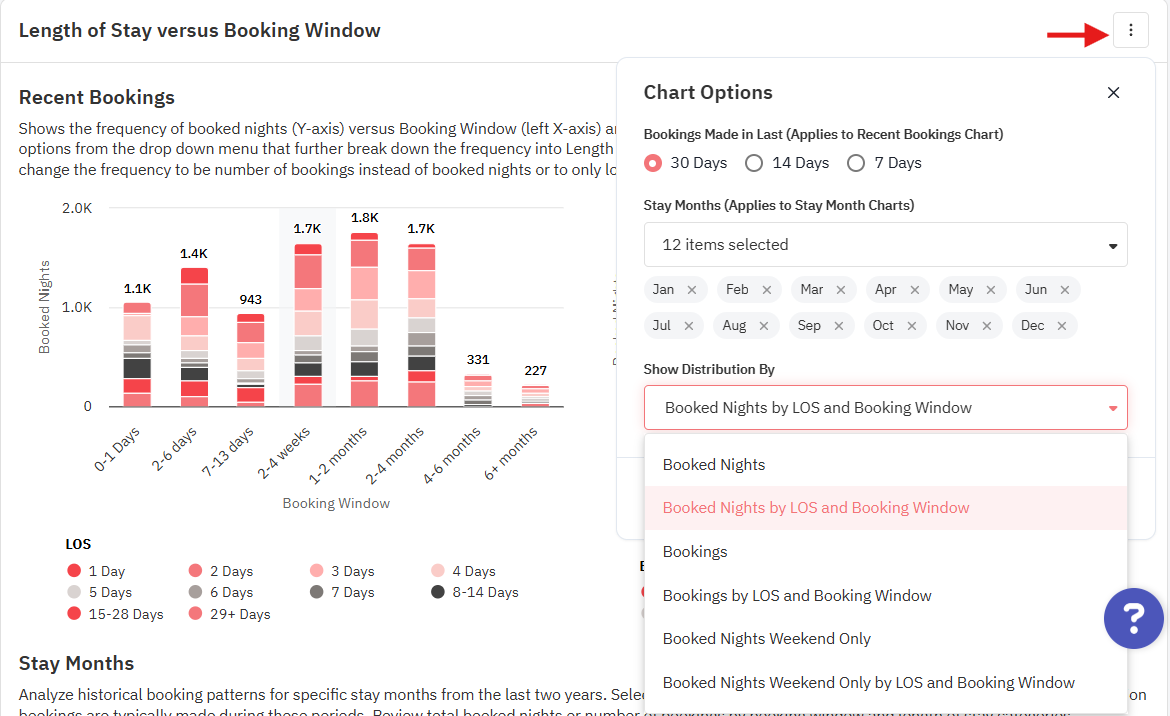
- Booked Nights
- Booked Nights by LOS and Booking Window
- Bookings
- Bookings by LOS and Booking Window
- Booked Nights Weekend Only
- Booked Nights Weekend Only by LOS and Booking Window
Related Articles
Understanding the Market Dashboards
Market Dashboards are fully automated personalized dashboards that can help you track your location’s STR booking data through easy to digest graphs and insights. New user accounts with listings imported in PriceLabs will be credited with 1 free ...Market Dashboards - Key Performance Indicators
This section details eight KPIs for the past 7 days, 30 days, or the last 365 days in the area compared to the previous period of the same length. This section is a great at-a-glance view of market trends for the area your dashboard covers and a good ...Market Dashboards: Glossary of Terms
Glossary of Terms Active Listing: A listing that is active or was active within the past 15 days on any booking platform like Airbnb or VRBO. Active Dates: This indicates how many days the listing was open to reservations. As an example, some host ...Listing Neighborhood Data
When pricing any listing, there are always several questions that come up: What is the average price in your area? How are prices compared to comps? How does occupancy compare? How are listings priced in the next months? Are they getting booked? Are ...Market Dashboard Use Cases
Estimated revenue The Market Dashboard allows you to evaluate your listing's performance by comparing its revenue with market averages for the selected period. If your earnings are below the market average, you can adjust your pricing strategy to ...
Sign up for training
To help you get the most out of PriceLabs, we have training webinars in English, Spanish, Portuguese and French. Click here to Register.