Setting your base price
What is the Base Price?
Your base price is the average nightly rate you'd charge across the whole year - not your peak price, not your floor. It's the single number where PriceLabs applies the adjustments to account for demand, seasons, and market conditions to calculate your daily rates. Every price your guests see flows from this one number.
Why this step is non-negotiable?
- It's your entire pricing foundation — Every nightly price PriceLabs sets is a % adjustment on top of your base. Get it wrong and every price is wrong.
- It signals your listing's quality — A luxury 2-bed should have a higher base than a basic 2-bed. This positions you correctly in the market.
- It keeps you competitive — Too high and you lose bookings in slow periods. Too low and you leave money behind when demand spikes.
- The algorithm learns from it — After 7 days, PriceLabs recommends a base price based on your listing’s performance. For example, if your place is booking faster than the market, it will suggest increasing your base price. This can also take up to 14-21 days if your listing is new.
Without a base price, PriceLabs cannot generate accurate recommendations for your listing. Set this before doing anything else in your setup.
How to set your base price?
Step 1 : Open the Base Price Help Tool
- Go to Pricing Dashboard → Review Prices and click "Help me choose a base price."
Step 2 : Choose your starting method
- Pick the option that matches your situation
- Market-Driven is the best starting point for most users. PriceLabs may ask for your Airbnb Listing ID, Cleaning Fee, and PMS Markup - provide these for the most accurate result.
Step 3 : Set the Base Price
If you are using Market-Driven Price
- Click Adjust Based on Market.
- Click Adjust Parameter
- Enter your Cleaning Fee, and PMS Markup (if needed)
PriceLabs needs this to compare your total guest price (nightly + cleaning) against competitors — not just the nightly rate alone. - Refine your comparison group to check Market-Driven Base Price (optional)
Three filters control which listings PriceLabs compares you against. Defaults are usually fine: - Property Category — Economy, Midscale, or Upscale.
- If you are unsure, you can leave the default selected.
- Bedroom Count — Defaults to your count. Auto-expands ±1 if fewer than 50 listings match. Aim for at least 30 listings in your comp set.
- Your Listing’s Airbnb URL — This is so we can examine reviews, amenities, fees, and other parameters to recommend the most accurate Base Price for your listing.
Click Edit URL then Add Manually.
Paste your Airbnb Listing ID or Airbnb URL.
Click Verify Listing.
Once the verification is successful, click the Save Changes button located at the top of the Airbnb ID Update section (as shown in the screenshot).
- Market Map — This is an advanced feature, recommended only for market experts.
- Shows all comp set listings. Your listing is the square icon. Hover any listing to see its average price, bedroom count, and listing ID. You can draw a custom area to narrow the geographic boundary.
- After any of these changes are saved, click Save Parameters in the footer of the page.
If you have been using PriceLabs and want to update your base price using the Recommended Base Price
- Simply Accept to apply the recommended base price
- You can also see the reason for the recommendation under How was this Price Calculated?
Step 4 : Check the Future Prices and review Market Data
Tick Show Market Data and click the Future Prices section at the bottom which shows where your price sits in the local market.
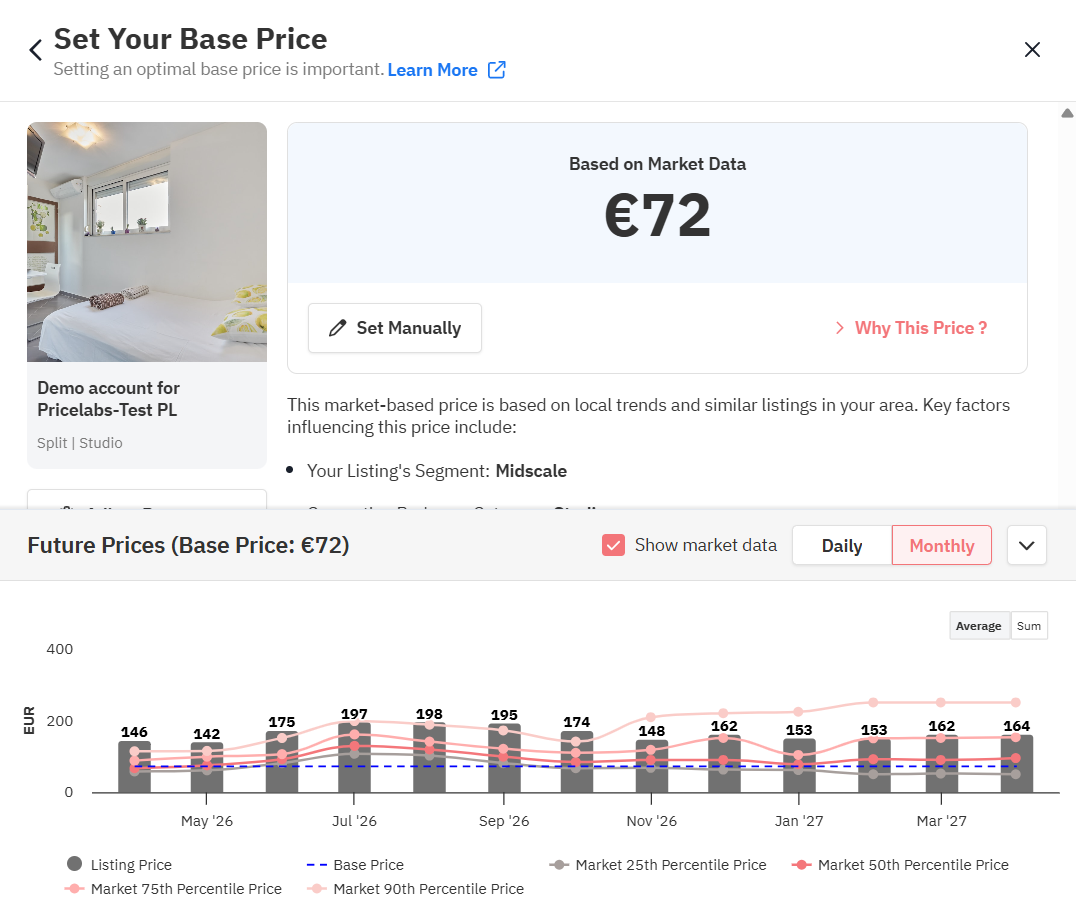
Before confirming, review the graph — it shows projected daily prices or average monthly prices across the year so you can sense-check your base for high and low seasons.
Step 5 : Respond to nudges and revisit regularly
PriceLabs monitors your base price continuously. If it detects a gap of more than 7% from its recommendation, you'll get a Base Price Nudge.
Nudges never auto-apply — you always choose to accept or reject. Click "See recommendation in Base Price Help Tool" to review the reasoning first.
Revisit every couple of weeks at first, then every few months once stable. Your full price history (min, base, max) is on the right side of the Calendar page.
What not to do?
- Don't make large jumps
Adjust in 5–10% increments and wait 1-2 weeks between changes. - If setting custom base price, don't include taxes in your base price
Taxes are added on top by the platform. Including them inflates your rate and makes your percentile comparisons inaccurate. - If setting custom base price, don't ignore platform commission fees
On a Host-only fee model you bear Airbnb's 15% commission; on a Split-fee model you bear 3%. If you've added a PMS Markup to cover OTA costs, make sure you exclude those from your base price. - Don't skip setting a minimum price
Without guardrails, dynamic adjustments can push your nightly rate unexpectedly low. Always set a min price alongside your base. - Avoid the high-season trapYour base price should reflect your yearly average. Setting it close to peak-season rates will push all prices too high, since PriceLabs already adjusts for seasonality.
How is Base Price calculated?
Market-Driven price — how the model works
PriceLabs starts with a Starting Price — the average price of comparable nearby listings including their cleaning fees. It then applies positive or negative adjustments based on how your listing compares to the local market average.
- Outperform the market → positive adjustment.
- Underperform → negative.
Impact level controls how much each factor shifts your final price.
To review the factors, click Why this Price?
Impact of a Sub-factor: Each sub-factor has a pre-determined Impact level: High, Medium, or Low. This level determines how much the model's adjustment (positive or negative) will affect your base price.
Info Icon: Hover the (i) icon next to any sub-factor in the tool to see exactly how it's affecting your specific price.
How the Recommended Base Price is generated?
After 7 days (or 14–21 days for new listings), of consistent price syncing with the same base price, PriceLabs generates a personalized recommendation based on your listing's performance vs. the market. It analyses a 60-day window, weighting recent data more heavily. Recommendations update weekly and apply for 7 days — there's always a short lag before recent changes are fully reflected.
Blocked dates: For most integrations, blocked dates count as booked when calculating occupancy. Too many blocks make the comparison unreliable — recommendations pause until blocks clear.
Below the Recommended Base Price, green upward pyramids (1–3) indicate suggested increases; red downward pyramids indicate decreases.
Percentile Score vs. Percentile Rank
The same dollar amount can mean different things depending on which mode you're using:
- Percentile Score (Market-Driven) — A market benchmark. If $250 is the 75th percentile, it means $250 separates the top 25% of listings from the bottom 75%.
- Percentile Rank (Custom) — A relative rank. If $250 is the 75th percentile rank, your price is higher than 75% of listings — but lower than the top 25%.
Market-Driven always shows 25th, 50th, and 75th percentile markers. Recommended and Custom modes show the exact percentile your selected price falls into.
How the comp set is built?
Your comp set only includes listings that meet all of these criteria:
Criterion | Rule |
Aim for at least 30 listings in your comp set. Expand bedroom categories or widen the map boundary if needed.
Frequently Asked Questions
How often should I change my base price?
- Your base price should be a stable, year-round average — seasonal fluctuations are handled automatically. When you do adjust, use 5–10% increments and wait 2–3 weeks between changes. You'll receive a nudge notification if a change is recommended.
It says "low historical occupancy" but my occupancy looks fine — why?
- Recommendations look at a 30-day trend over the past 60 days — not just today's snapshot. They update weekly and apply for 7 days, so recent improvements take a little time to fully show up.
Why isn't my Recommended Base Price changing?
- If your occupancy is stable and aligned with the market, the algorithm concludes no change is needed. This is the expected outcome — it means your price is well-calibrated.
Why does the recommendation always mirror my manually set price?
- When you change your base manually, the algorithm reinforces that price while collecting new data. Frequent changes prevent proper recalibration. Keep your price stable for 2–3 weeks after any change.
The Recommended Base Price seems way off. What do I do?
- Start fresh with a Market-Driven or Custom price. After 2–3 weeks the algorithm recalibrates from that new starting point and will generate a more accurate recommendation.
When will I get a Recommended Base Price for the first time?
- After 14–21 days of consistent price syncing. If it's blank after a recent base price change, give it a few days to recalibrate.
Where can I see my base price history?
- Your past minimum, base, and maximum prices are on the right side of the Calendar page.
How do I set a different base price for specific dates only?
- Use Date-Specific Override in Price Settings. Contact support@pricelabs.co if you don't see this option in your account.
Related Articles
Hotels – Setting the Base Price for a Room Type
Base price is the average rate you would charge across the year. It serves as a starting point, with market factors, demand patterns, and customizations applied on top. Base Price Help The Base Price Help tool analyzes nearby hotels and provides a ...What are minimum, base, and maximum prices- How to set them up?
We’re sure you must have seen fields for Min, Base, and Max prices over a few places within PriceLabs. This article will explain what these terms are along with their purpose. Minimum Price The minimum price is the lowest price you set for their ...Don’t Skip This! The Ultimate Checklist to Ensure Your PriceLabs Setup is On Point!
We’ve made this checklist super easy to follow, with clear examples to help you avoid common setup mistakes. Let’s get started! 1. Add Listings From the Right Source Do you use a PMS/Channel Manager? ⬜ Yes? Then make sure to add your listings from ...Advanced Minimum Price Settings
General Minimum Price Rules Minimum price rules follow PriceLabs’ customization hierarchy, meaning that certain overrides may allow prices to drop below a listing’s set lowest price. When setting a minimum price, you can choose from three options: ...Hotel Rate Shopper (Listing Hotel Data)
Knowing how hotels and short-term rentals are performing in your area is essential because potential guests consider both options when planning their vacations. Keeping track of both types of accommodations allows you to stay competitive in your ...
Sign up for training
To help you get the most out of PriceLabs, we have training webinars in English, Spanish, Portuguese and French. Click here to Register.