Market Dashboards - Key Performance Indicators
This section details eight KPIs for the past 7 days, 30 days, or the last 365 days in the area compared to the previous period of the same length. This section is a great at-a-glance view of market trends for the area your dashboard covers and a good way to spot seasonal (and pandemic-related) changes in guests' booking behavior.
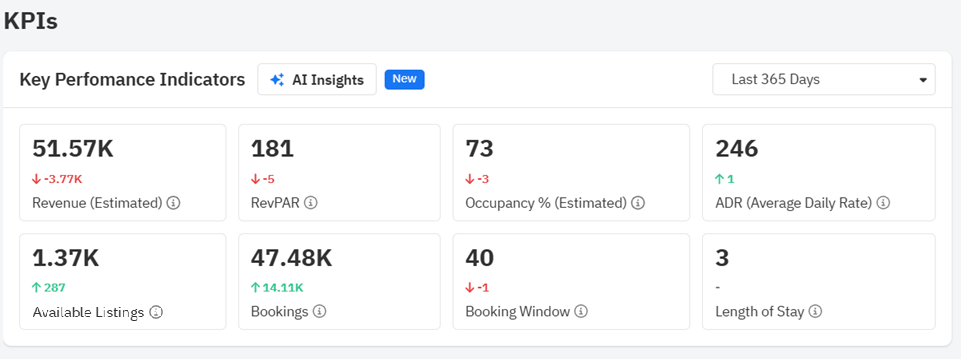
- Revenue - for the past period is shown in the currency selected for your report; the smaller number on the side is the change compared to the previous period. In this example, listings in this area have seen an average revenue of 51.57K in the past 365 days, which is an decrease of $3.77K compared to the previous 365-day period.
- RevPAR - RevPAR can effectively predict your ADR’s success in filling available rooms. This, therefore, provides a constructive view of your property’s operational performance. It is the balance between the occupancy rate and ADR; it is the occupancy rate multiplied by the average daily rate. Read more
- Occupancy % - percentage for the area is also shown for the past 365 days compared to the 365 days prior to that. Listings in this area have seen, on average, 73% occupancy for the past 365 days, which is down by 7% from the previous period.
- ADR - It is the total rent divided by the number of nights within a given time period. An indicator of the average price of a vacation rental is calculated by dividing the total revenue generated in a vacation rental by the number of nights the vacation rental was booked. It is essentially the booked rate and does not include the prices for open nights. Read more
- Available Listings shows the average number of active listings for the past 365 days also compared to the previous 365-day period. There are currently 1.37K active listings in this area, which is 287 more than the previous period.
- Bookings shows the total number of stays booked for listings in the area for the past 365 days, compared to the previous 365-day period. These are bookings made, not necessarily stays that occurred, as some stays will have longer booking windows than others.
- Booking Window shows how far in advance stays were booked in the past 365 days compared to the previous period. This area has seen a few more bookings coming in a bit farther in advance this period compared to the last
- Length of Stay, not the average, shown for bookings made in the past 365 days compared to the previous period. We show the median here to account for the long-term stays booked in the periods shown.
Related Articles
Understanding the Market Dashboards
Market Dashboards are fully automated personalized dashboards that can help you track your location’s STR booking data through easy to digest graphs and insights. New user accounts with listings imported in PriceLabs will be credited with 1 free ...Market Dashboards - Amenities
This section has two charts detailing desired features in a listing by comparing the percentage of listings with an amenity to the percentage of bookings with the amenity. The Common Amenities chart orders the amenities by the percentage of listings ...Market Dashboards - Price and Occupancy Trends
Key Future Dates Key Future Dates spotlights a few dates that have a higher occupancy percentage compared to the dates surrounding them. You can use the dates shown here to spot emerging high-demand periods and adjust pricing and stay requirements ...Market Dashboard Use Cases
Estimated revenue The Market Dashboard allows you to evaluate your listing's performance by comparing its revenue with market averages for the selected period. If your earnings are below the market average, you can adjust your pricing strategy to ...Market Dashboards: Glossary of Terms
Glossary of Terms Active Listing: A listing that is active or was active within the past 15 days on any booking platform like Airbnb or VRBO. Active Dates: This indicates how many days the listing was open to reservations. As an example, some host ...
Sign up for training
To help you get the most out of PriceLabs, we have training webinars in English, Spanish, Portuguese and French. Click here to Register.