Market Dashboards - Market Summary
Market History
The Market History charts show the average revenue, average RevPar, average ADR, average occupancy, median booking window, and median length of stay for listings that saw bookings in that month. If a booking spanned multiple months, the revenue for that stay counts toward the month with the check-in date. You can view these trends averaged by month for the entire market, or by bedroom category.
You can click the menu to see those figures broken down by bedroom category if you'd like to see a more detailed view for each month.
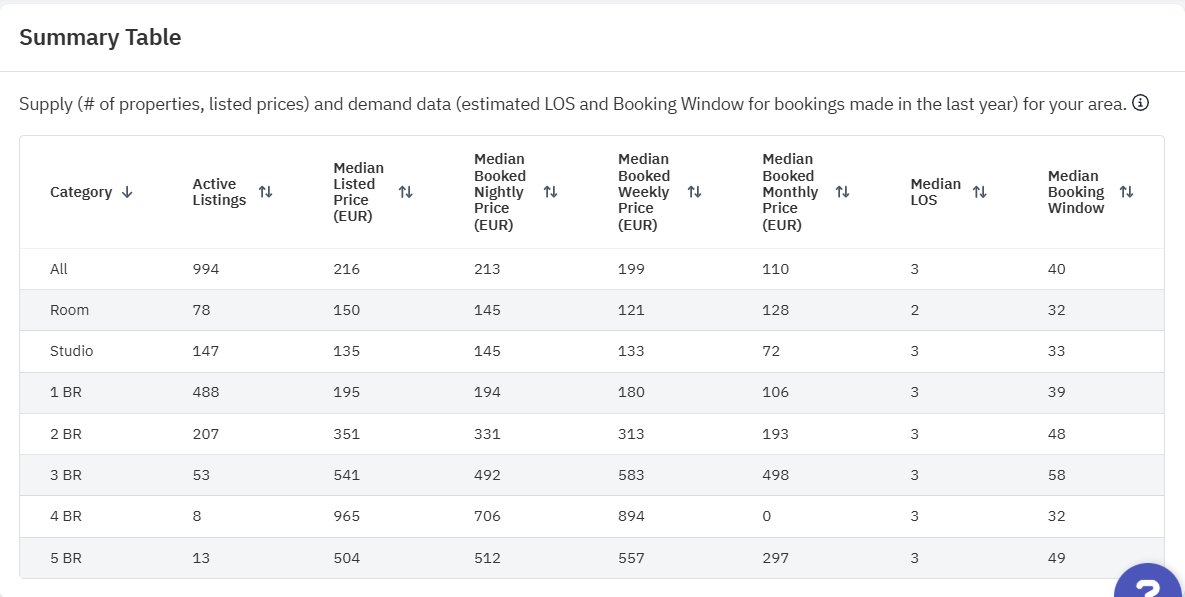
Summary Table
The Summary Table shows the number of active listings in the area, along with median pricing (nightly, weekly, and monthly), LOS, and booking window we've seen over the past year for the full set of listings and each bedroom category.
Supply And Demand
The Supply and Demand charts below the table show the total booked nights (demand) received in a 7 day time period or indicated month ending on the indicated date. You can also see the number of total active listings for that period as well.
Related Articles
AI Features in Market Dashboards
We’ve introduced AI-powered insights in the Market Dashboards to help users quickly identify key metrics and trends. Here's how the new AI feature enhances your data analysis: Quick Insights on Metric Changes: The AI engine automatically identifies ...Understanding the Market Dashboards
Market Dashboards are fully automated personalized dashboards that can help you track your location’s STR booking data through easy to digest graphs and insights. New user accounts with listings imported in PriceLabs will be credited with 1 free ...Market Dashboards: Glossary of Terms
Glossary of Terms Active Listing: A listing that is active or was active within the past 15 days on any booking platform like Airbnb or VRBO. Active Dates: This indicates how many days the listing was open to reservations. As an example, some host ...Market Dashboards - Amenities
This section has two charts detailing desired features in a listing by comparing the percentage of listings with an amenity to the percentage of bookings with the amenity. The Common Amenities chart orders the amenities by the percentage of listings ...Market Dashboards - Key Performance Indicators
This section details eight KPIs for the past 7 days, 30 days, or the last 365 days in the area compared to the previous period of the same length. This section is a great at-a-glance view of market trends for the area your dashboard covers and a good ...
Sign up for training
To help you get the most out of PriceLabs, we have training webinars in English, Spanish, Portuguese and French. Click here to Register.