Market Dashboard Methodology: Data Sources and Processing
Data Gathering
Currently Market Dashboards is using scraped data from Airbnb (and VRBO too). For a listing, all data we gather could be found by going to that listing’s public Airbnb/VRBO page and looking through their calendar and the listing info they provide. We then keep records of how their calendar has changed, what dates have become unavailable (or re-available), how their prices have changed, etc. and we build up a history for that listing. We currently do this for all listings that appear on Airbnb/VRBO. Using scraped data enables us to provide Market Dashboards for any location around the world (regardless of whether we have customers there or not).
Data Processing
Much of the booking data we show on Market Dashboards is not directly available from a listing’s calendar. Data like Booking Window, Length of Stay, Booked Date, and Booked Price are instead inferred from the changes we see to a listing’s calendar over time. If consecutive dates become unavailable from one scraping to the next, we will initially mark it as a single booking. Due to the frequency at which we scrape the booked date is well determined and the chances that it is two separate consecutive bookings is low. We can then calculate the Booking Window and Length of stay for this booking. The booked price is then assign based on the last listed prices for those dates we saw prior to the dates becoming unavailable.
Block Removal
One of the main challenges for scraped data is that there is no guaranteed way of determining if specific dates are not available because they were booked or if the owner has decided to block those dates. Everyone using scraped data faces this issue and generally has some way in which to try and remove these blocked dates from the data, and no method is perfect. PriceLabs has its own block removal logic that looks at patterns in the whole market as well as individual listing data to help us determine whether a booking is real or a block. Some factors of a booking we look at to determine if it is a block or not are: Length of Stay, Booking Window, Market Occupancy, extreme price variations, and more. We also automatically remove any stay greater than 60 days as we feel they do not fall under the Short-Term Rental category and can have a large impact on the data.
Bookings made on other OTAs or Direct Website
As long as a property is listed on Airbnb in addition to other OTAs, we still are able to deduce bookings on other OTAs as they block the calendar on Airbnb. As described above, once a date is unavailable (either due to a booking on Airbnb, or from any other OTA) we use our block detection logic to identify whether it's a booking (made through any channel) or a blocked date.
Dynamic Pricing Analysis for listings in your market/comp set
When creating listing comp sets, you will see a column named "Dynamic Pricing". Here's what it means:
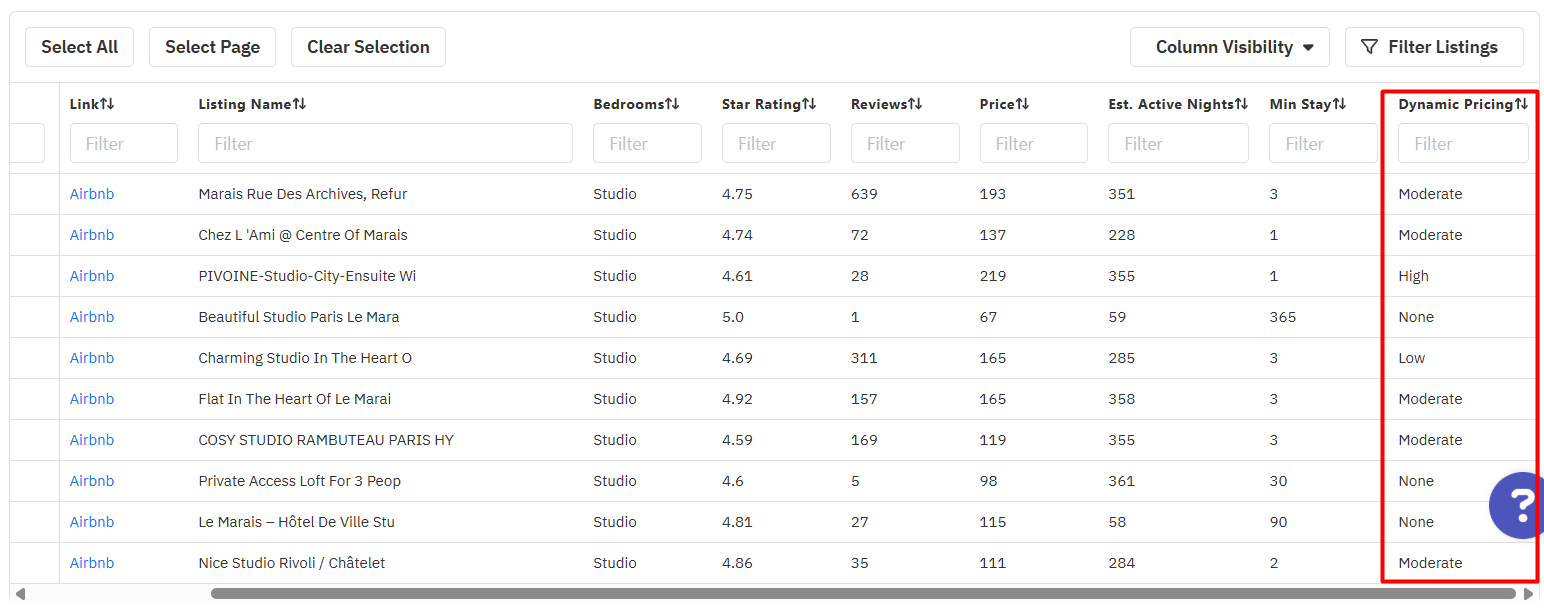
We track the prices of each listing and score them on a 0 to 1 scale on both day to day price variation as well as how much their prices have changed for the same day since the last time we checked. A 1.0 would indicating their prices vary strongly from one day to the next and are constantly changing, while a zero indicates the price is always constant. For reference, an average PriceLabs user generally falls into the 0.6 - 0.8 range depending on the customizations set on their individual account.
For the table we then bin these scores:
For the table we then bin these scores:
- None: score 0.0 - 0.1, these listings almost never change their prices
- Low: score 0.1 - 0.25, these listings may change their prices for holidays and events, but their overall price week to week is pretty constant
- Moderate: score 0.25 - 0.5, these listings prices vary week to week but the variance is overall small and prices don't update too often (someone manually updating their prices every week may fall into this category)
- High: score > 0.5, these listings prices account for DOW and holiday/event demand changes and update every few days (listing is most likely using some dynamic pricing software to update their prices on a daily basis).
Frequently Asked Questions
Why do we sometimes use Median instead of Mean?
There tends to be a few outliers in every market that set extremely high prices or only take extremely long bookings, the listings are not indicative of the market but would have a large effect when calculating the mean for these values. Median on the other hand is more stable and resistant to outlier behavior.
In the listing table (under Location Map) how do you classify professionally managed listings?
We use 4 categories: Individual, Small, Moderate, Large. The individual category is for property managers that only have a single listing tied to their account, Small means they have between 2 and 10 listings, Moderate between 11 and 50 listings, and Large is 51 or more listings. Unknown may appear if we haven’t yet determined how many listings the property manager has.
Is there a way to search for Airbnb Luxe listings using the dashboard?
Not currently
Why do some listings have extremely high occupancy/revenue in the past 30 days even though the market as a whole isn’t doing well?
It is likely that at least some of the bookings we have assigned to that listing are actually blocks that we missed. Our block removal isn’t perfect but do send us cases you find suspicious so that we can try to improve!
Related Articles
What is Market Dashboard and how to use it?
Market Dashboards are fully automated personalized dashboards that can help you track your location’s STR booking data through easy to digest graphs and insights. New user accounts with listings imported in PriceLabs will be credited with 1 free ...Market Dashboard vs Revenue Estimator Pro
Both Market Dashboard and Revenue Estimator Pro are two powerful solutions offered by PriceLabs that are designed to provide actionable insights, but they cater to different needs. Revenue Estimator Pro focuses on delivering insights on potential ...Market Dashboard Use Cases
Estimated revenue The Market Dashboard allows you to evaluate your listing's performance by comparing its revenue with market averages for the selected period. If your earnings are below the market average, you can adjust your pricing strategy to ...Market Dashboards: Glossary of Terms
Glossary of Terms Active Listing: A listing that is active or was active within the past 15 days on any booking platform like Airbnb or VRBO. Active Dates: This indicates how many days the listing was open to reservations. As an example, some host ...Listing Neighborhood Data
When pricing any listing, there are always several questions that come up: What is the average price in your area? How are prices compared to comps? How does occupancy compare? How are listings priced in the next months? Are they getting booked? Are ...
Sign up for training
To help you get the most out of PriceLabs, we have training webinars in English, Spanish, Portuguese and French. Click here to Register.